Greg Cooke
Postdoctoral research associate at the Institute of Astronomy, University of Cambridge.
Click any section below to read more about my research and code.
Postdoctoral research associate at the Institute of Astronomy, University of Cambridge.
Click any section below to read more about my research and code.
Institute of Astronomy, University of Cambridge
I am a postdoctoral researcher who uses a variety of models to investigate habitable and inhabited planets. From early Earth to Earth-like exoplanets, and to the exciting regime of sub-Neptune hycean worlds. To do this, I use a variety of computational tools. This has included state-of-the-art 3D chemistry climate models, 1D photochemical models, and an ecological model that I have developed. I also connect simulations to possible future observations, trying to understand the wide variety of possible spectra that inhabited exoplanets may reveal to our future telescopes.
Additionally, I am involved in significant science outreach activities. This includes public speaking, events hosted at the Institute of Astronomy and Cambridge, and gender analysis of the entire science curriculum of the UK available for 14-18 year olds with a view to improve representation and recognition for trailblazing women scientists.
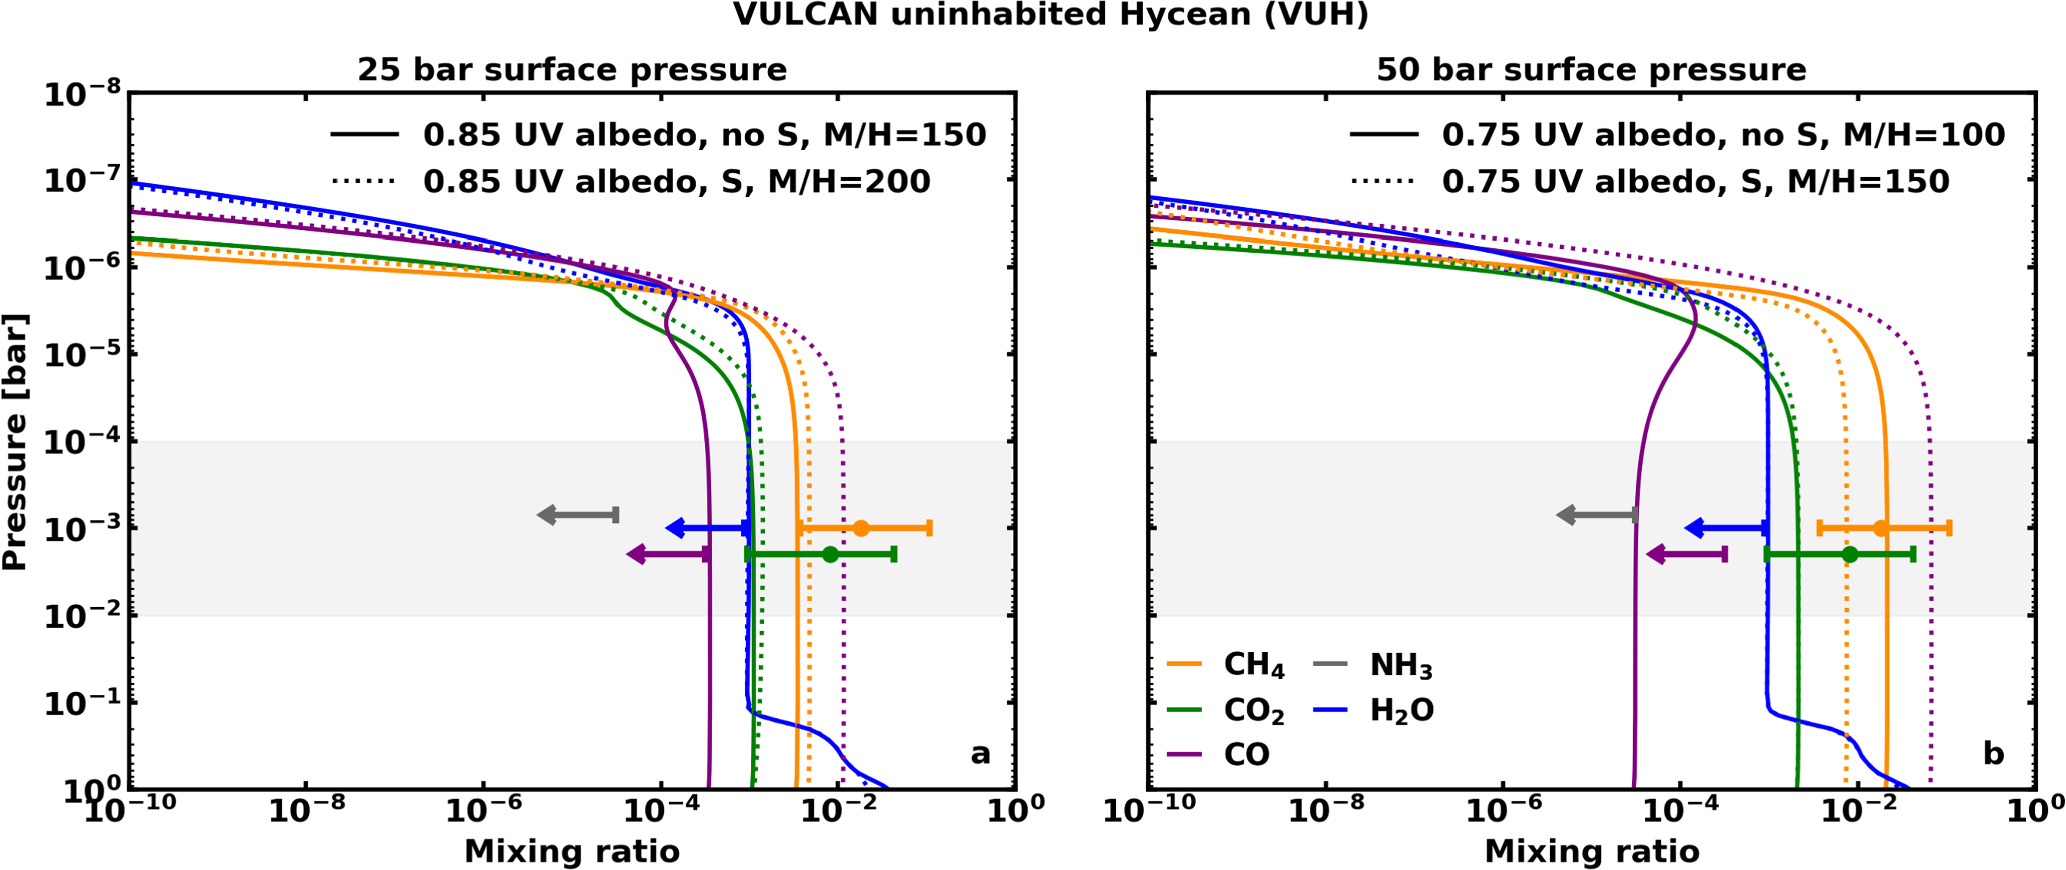
Photochemical modelling of K2-18 b with JWST
The James Webb Space Telescope (JWST) is transforming our understanding of temperate sub-Neptunes, starting with groundbreaking observations of K2-18 b, a habitable-zone sub-Neptune. By detecting methane (CH4) and carbon dioxide (CO2) and not detecting (NH3) and carbon monoxide (CO), JWST's findings align with the concept of a Hycean world—a planet with a hydrogen-rich atmosphere and a potential habitable ocean.
However, recent research suggests these findings might also fit a mini-Neptune scenario (amongst other scenarios). Using independent photochemical modeling, we analyzed how key factors like atmospheric chemistry, stellar radiation, and surface properties influence K2-18 b's observed abundances.
Our results indicate that the mini-Neptune scenario currently does not explain the data, while both inhabited and uninhabited Hycean models fit better. An uninhabited Hycean world explains most observations, though CH4 levels remain challenging to match. In an inhabited scenario, CH4 could be biogenic although caution must be urged with such an explanation.
This study highlights the need for detailed modeling to interpret chemical signatures and advance our search for life on exoplanets.
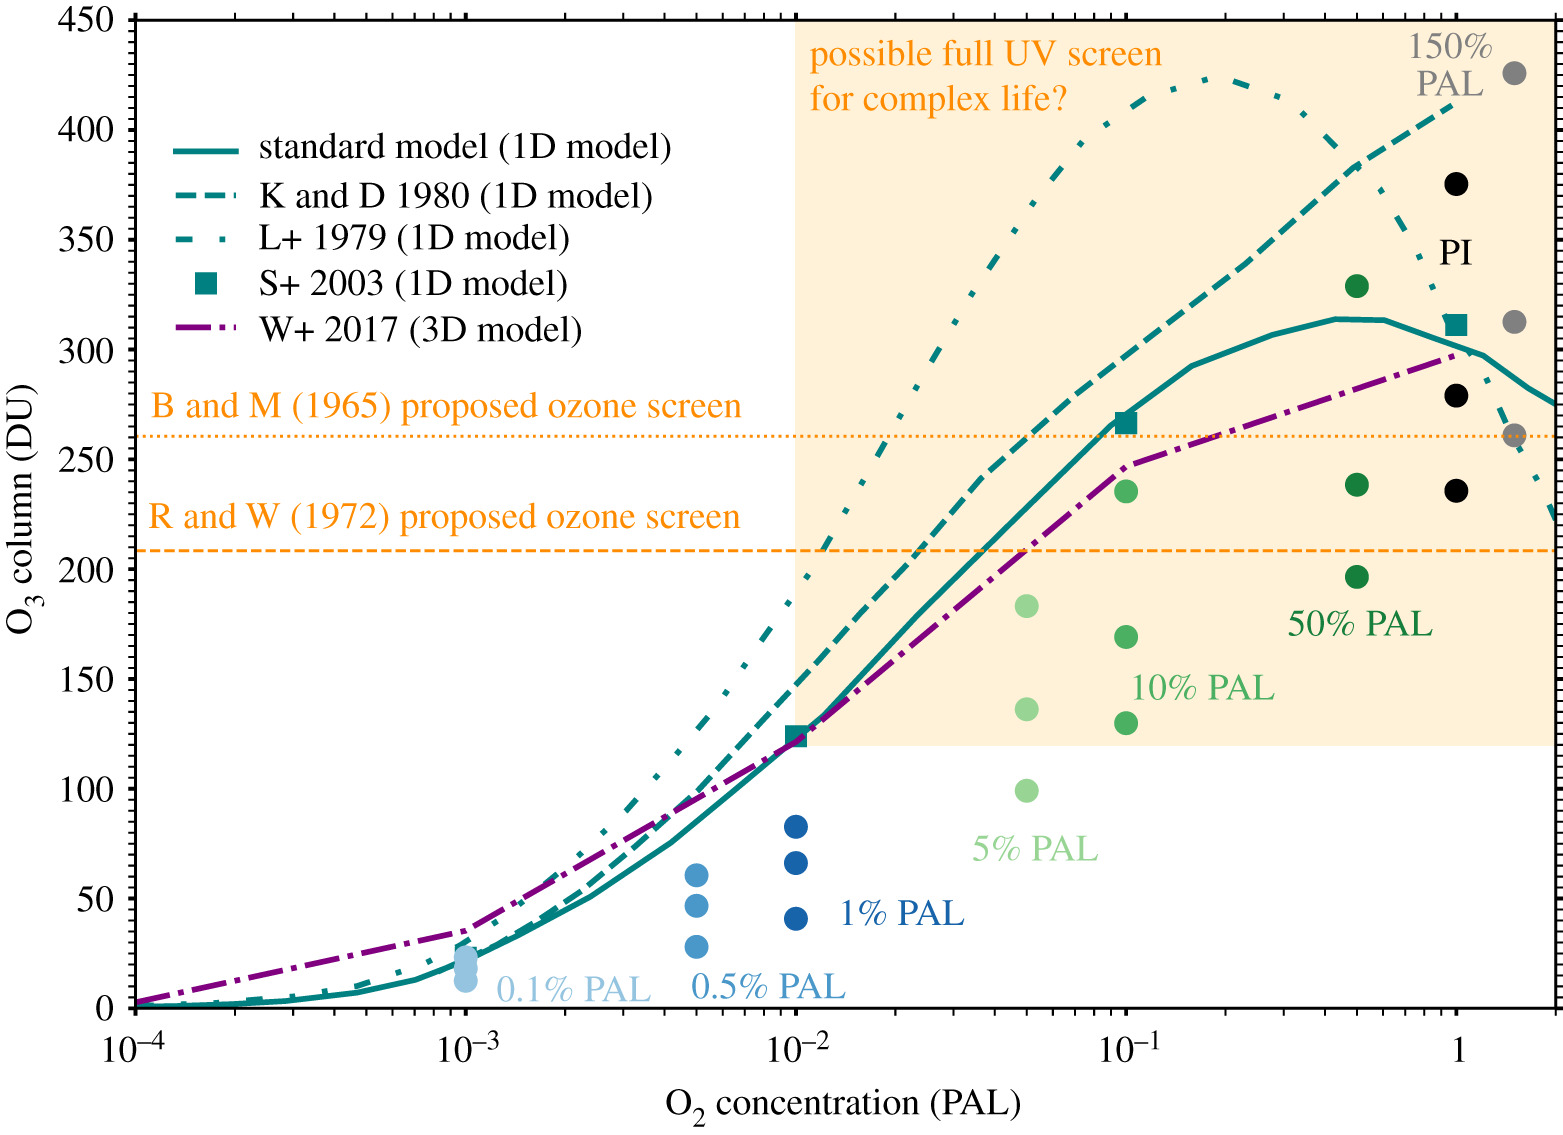
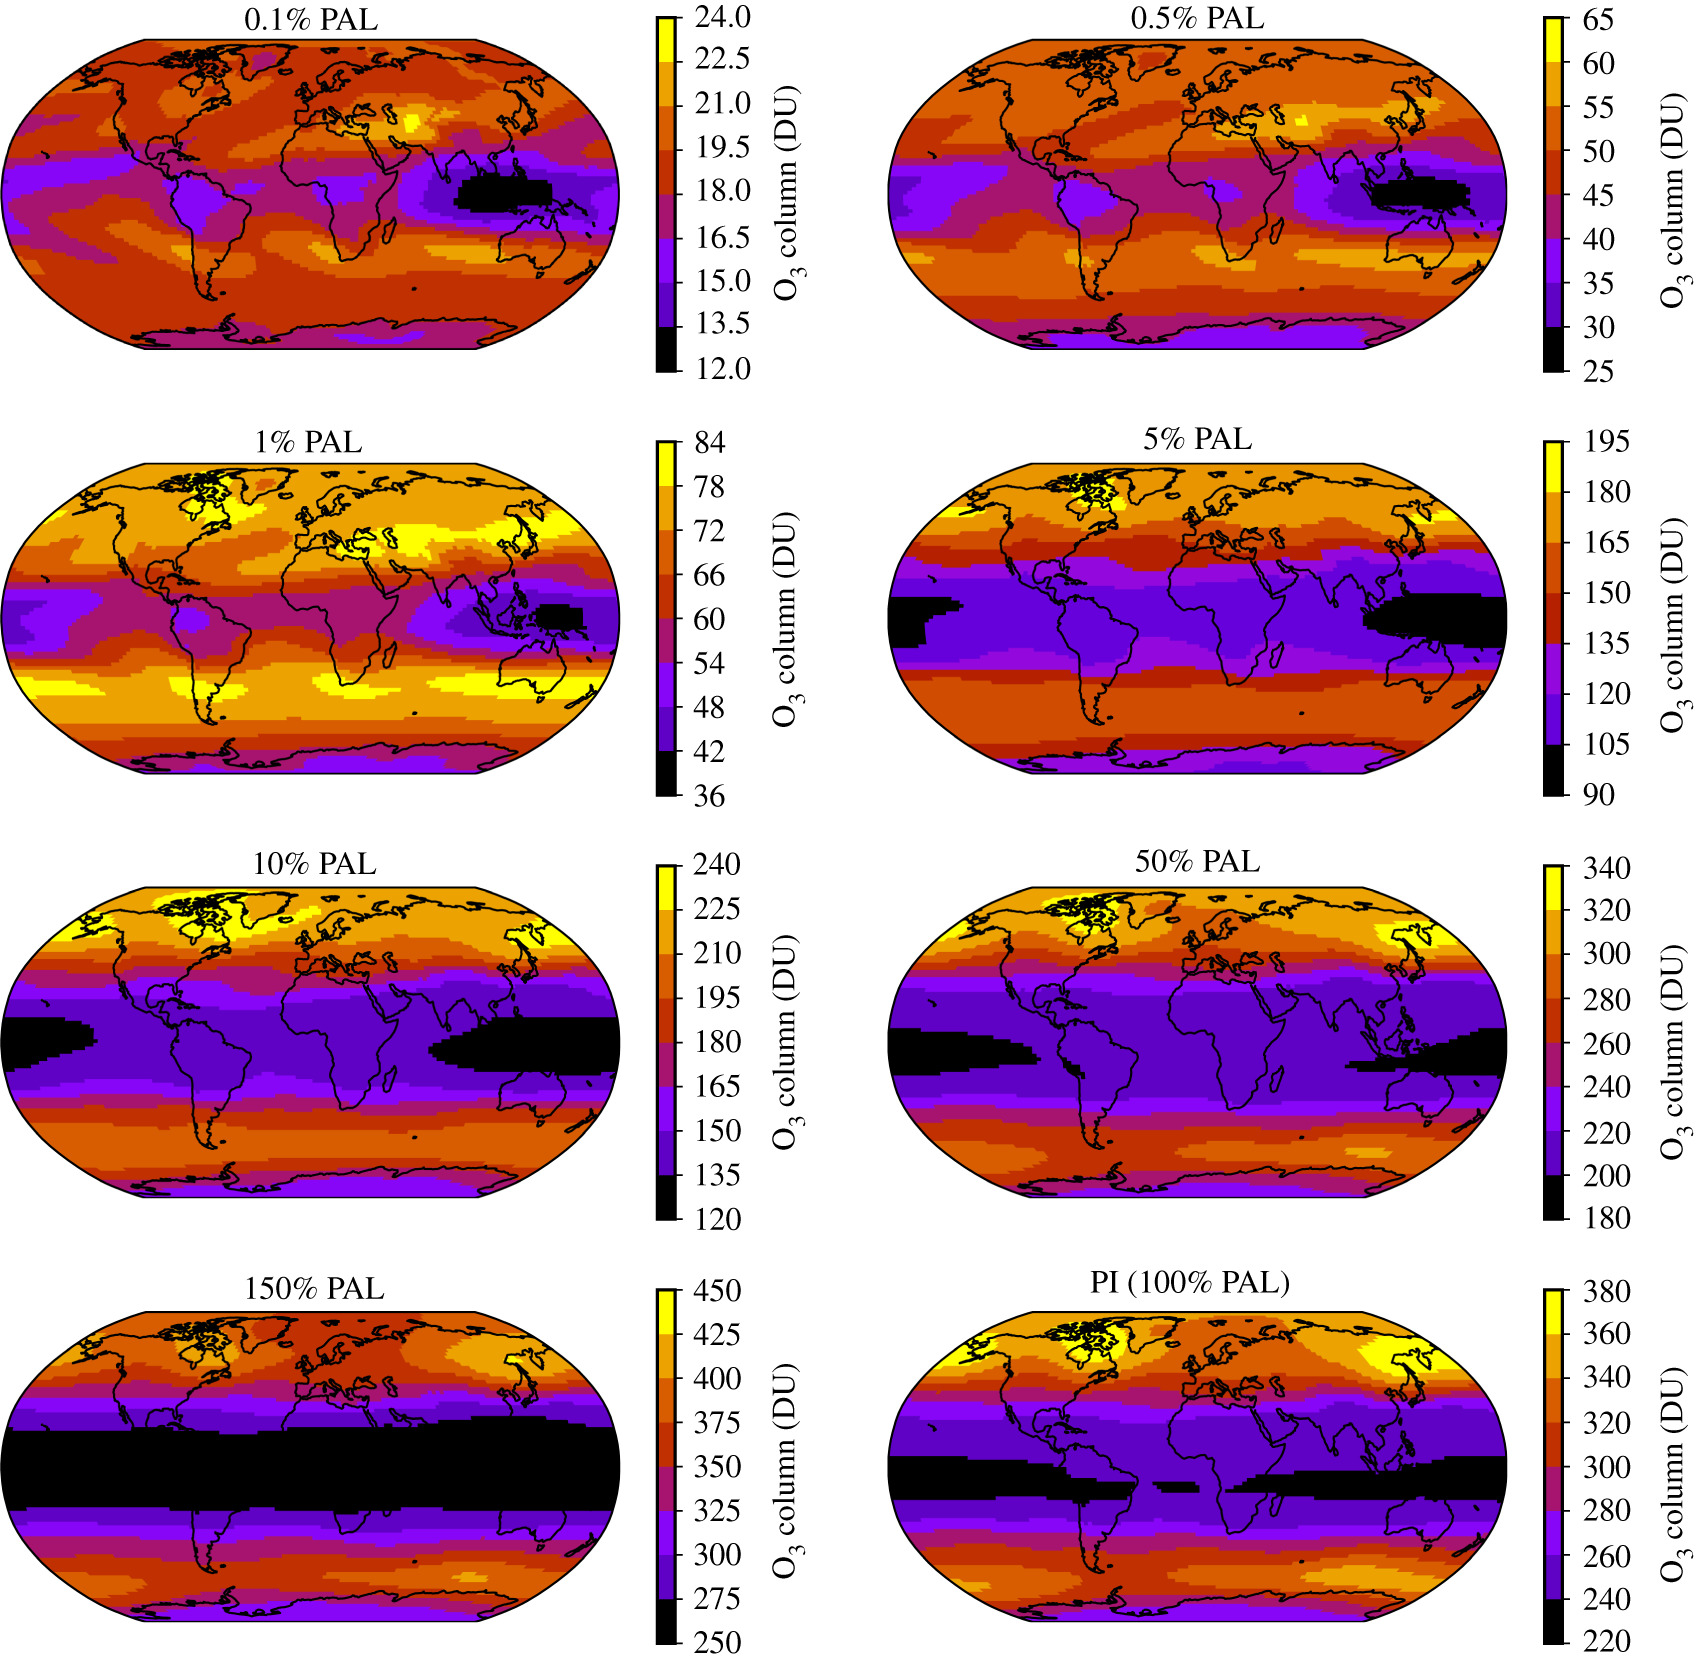
Simulating Earth from 0.001 to 1.5 PAL oxygen
Using WACCM6, we simulated the Earth with 1000 times less than the present atmospheric level (PAL) of oxygen, all the way up to 1.5 times PAL. We found lower ozone columns compared to previous 1D and 3D modelling, meaning that more ultraviolet radiation than previously anticipated could have reached the surface during the Proterozoic. See the following paper for more details: Cooke G. J., Marsh D. R., Walsh C., Black B. and Lamarque J.-F. 2022. A revised lower estimate of ozone columns during Earth's oxygenated history. R. Soc. open sci.9211165211165. http://doi.org/10.1098/rsos.211165.

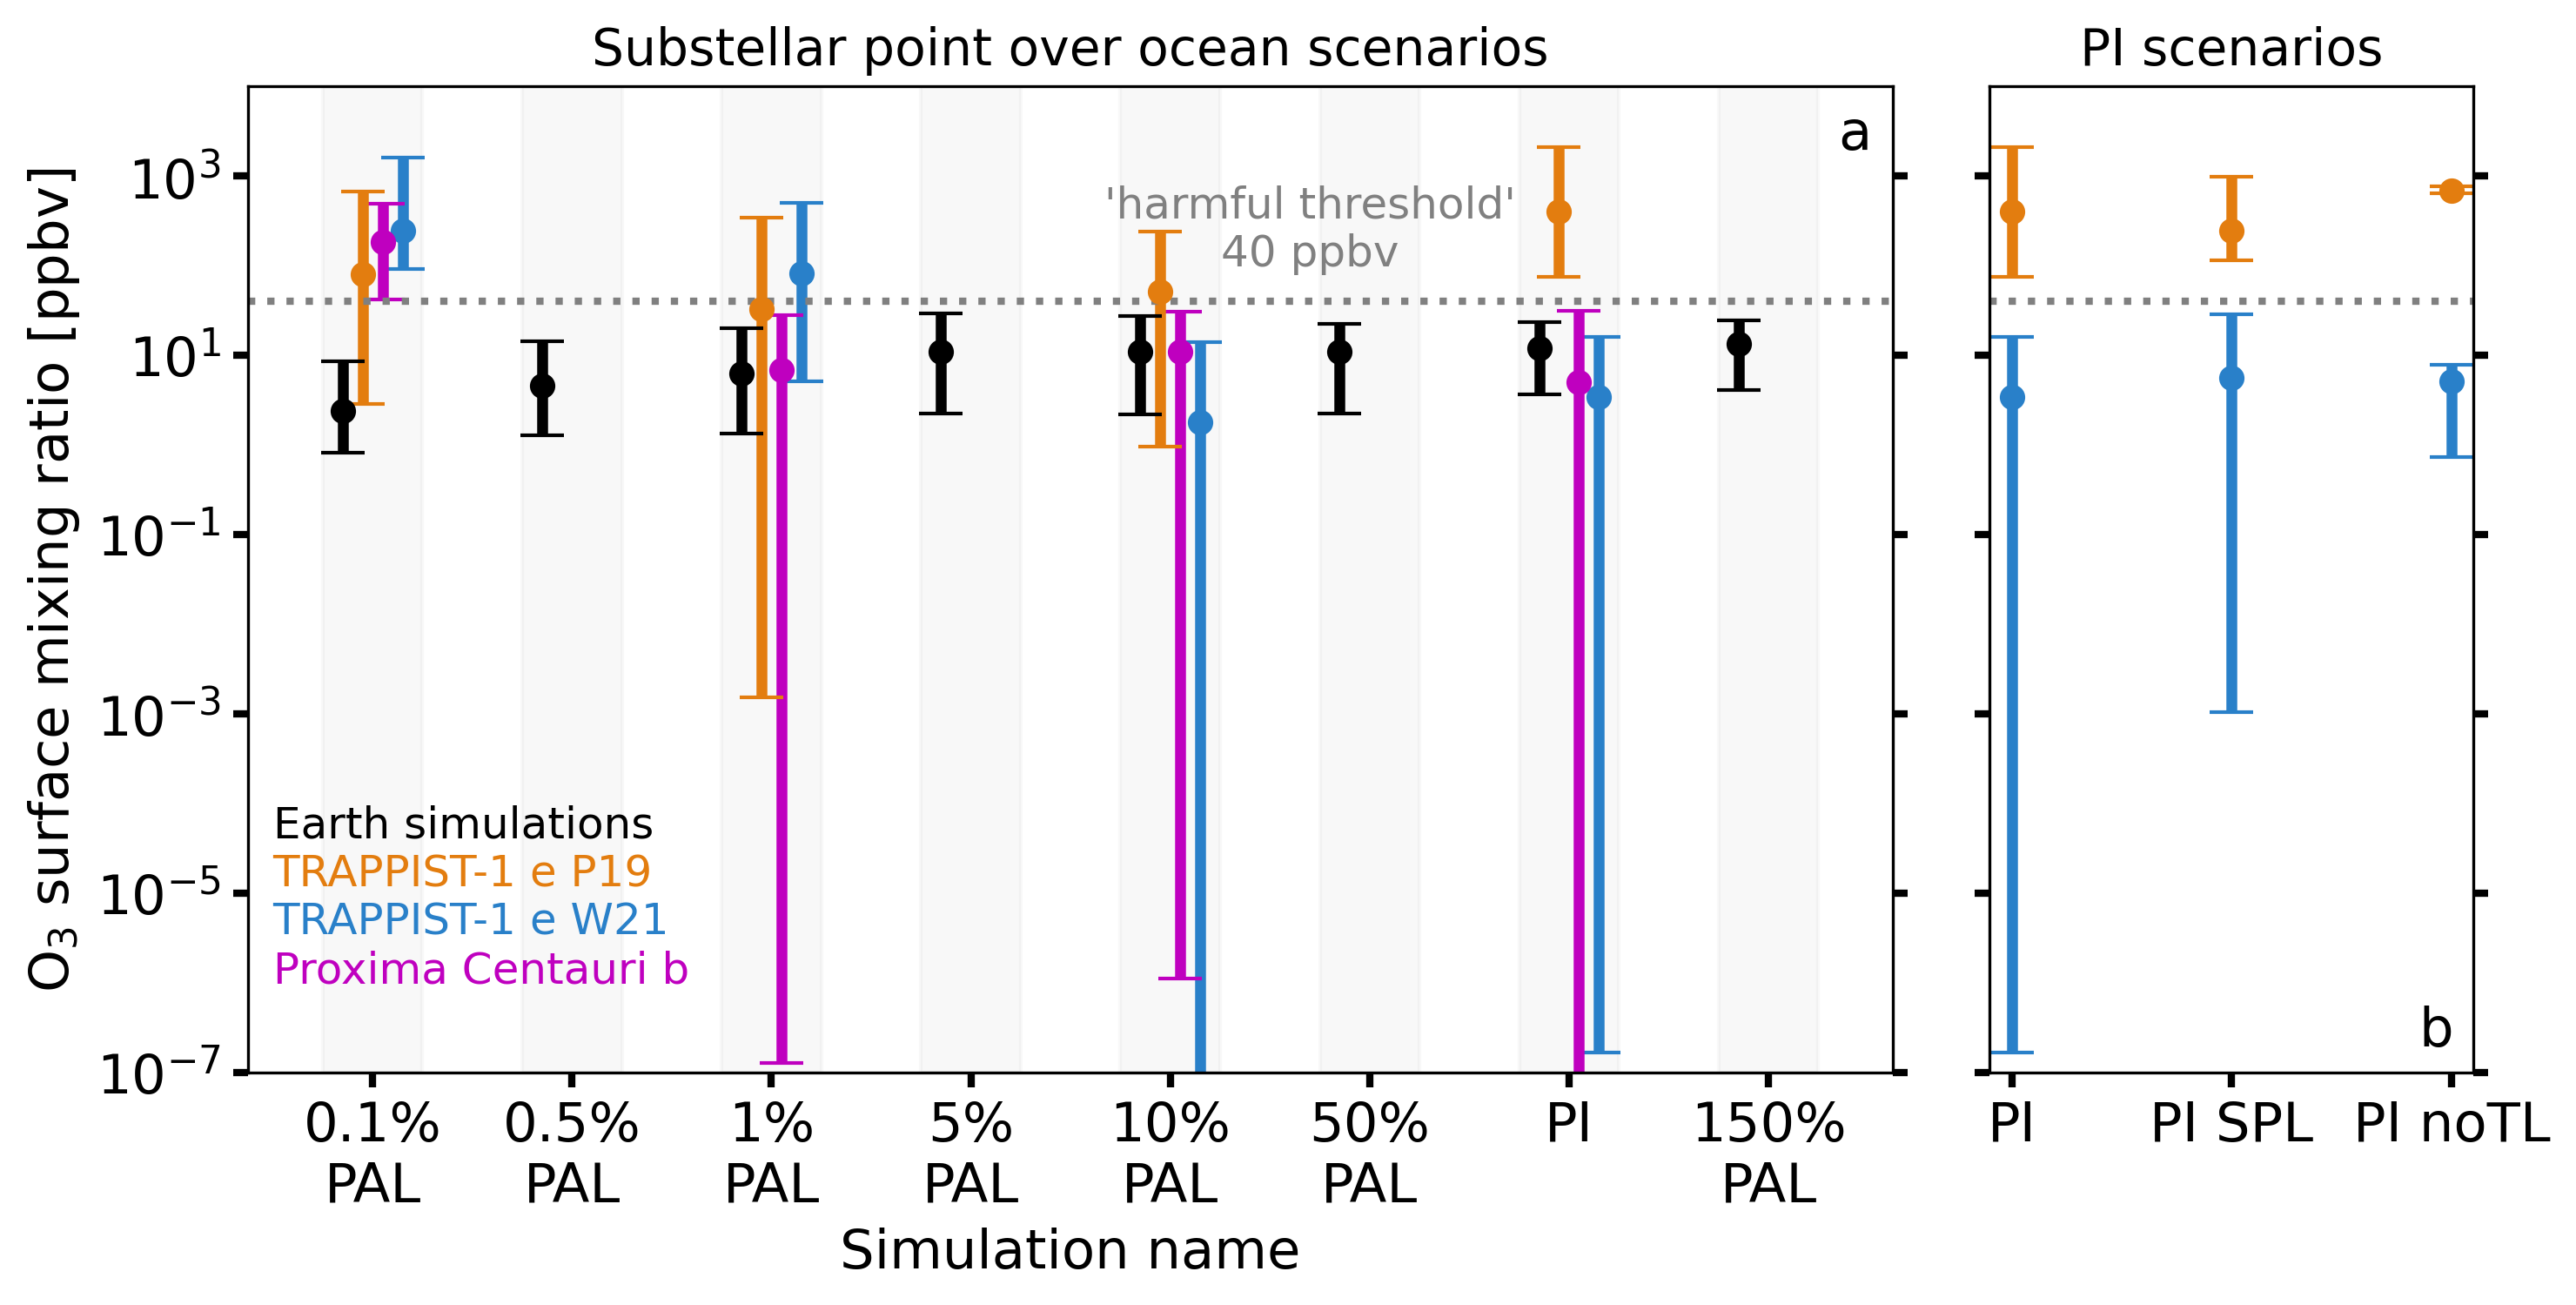
Lethal surface O3 on habitable zone exoplanets
O3 is a double-edged sword in Earth's atmosphere—vital for protecting life by filtering harmful ultraviolet (UV) radiation, yet a dangerous pollutant at ground level due to human activities. As a powerful oxidizer, ground-level O3 can be harmful (and in some cases lethal) to many organisms.
We investigated two exoplanets: TRAPPIST-1e and Proxima Centauri b, using the advanced Whole Atmosphere Community Climate Model version 6 (WACCM6). Through a series of twelve simulations for TRAPPIST-1 e and four for Proxima Centauri b, we explored various O2 concentrations. Our findings reveal that certain conditions lead to surface O3 levels far exceeding a 40 ppbv threshold which is deemed harmful to some lifeforms on Earth (e.g. vegetation). In fact, some scenarios reach up to 2200 ppbv surface miximg ratios. This would be fatal to most life on Earth, including humans.
However, not all scenarios are bleak. Some simulations show that surface O3 remains below harmful levels across significant areas, though some regions may still pose risks. This is an extra dimension that should be considered when evaluating the habitability of terrestrial exoplanets.
Stellar UV uncertainties and O3 spectral features
We simulated 10 different planetary scenarios for TRAPPIST-1e, a potentially habitable exoplanet: 5 cases with one incoming stellar spectrum, and 5 cases with another. One of these was from Peacock et al. (2019), and the other from Wilson et al. (2021). The latter has much lower ultraviolet (UV) emission than the former. UV emission is important for atmospheric chemistry and the habitability of the surface. Ultimately, the quiescent UV flux is unknown, and TRAPPIST-1 is an active star, so the incident flux will likely vary anyway. This is a general problem, one not isolated to the TRAPPIST-1 system. As we showed in our paper, it can have imporatnt consequences for observational ambiguities when the UV flux is not well-constrained.
More incident UV radiation allows increased photolysis of atmospheric constituents, including O2. O2 photolysis produces two O atoms. O3 is then made through the three body reaction O2 + O + M --> O3 + M, where M is any third body (usually O2 or N2 on Earth). Thus, the production rate of O3 depends not only on the density of O and O2, but on the density of the atmosphere as well. The final predicted amount of atmospheric O3 depends on the interplay between the three-dimensional nature of the planet (transport and no nightside photochemistry), the incoming UV radiation, and the O2 mixing ratio. With more UV, the peak O2 photolysis is closer to the ground. With less O2, UV can also penetrate further. The closer to the surface that O2 photolysis occurs, the greater the O3 production rate, provided that there is enough O2 and O to not limit the reaction rate.
This can mean some weird results occur for the predicted transmission spectra. The W21 pre-industrial (PI) case has undetectable O3 at visible wavelengths (0.6 µm), the lowest height feature at infrared wavelengths, but is actually the most detectable at UV wavelengths (0.25 µm). There are also some cases which overlap in the infrared: W21 1% PAL and P19 PI; W21 0.1% PAL and P19 1% PAL; and W21 10% PAL and P19 10% PAL.
What would these exoplanets look like through next-generation telescopes?
Cooke et al. (2023), Variability due to climate and chemistry in observations of oxygenated Earth-analogue exoplanets has been published in MNRAS. We investigated the annual and seasonal variability in observations of oxygenated Earth-like exoplanets with next generation telescope concepts (LUVOIR and HabEx). Large variations in planetary brightness occur. Depending on the telescope used and its coronagraph, confirming annual and/or seasonal variability may be possible. We found that clouds, chemistry and surface albedo are all important when considering temporal variability. 3D chemistry climate models are crucial tools for predicting future observations and the detection possibilities that future missions may yield.
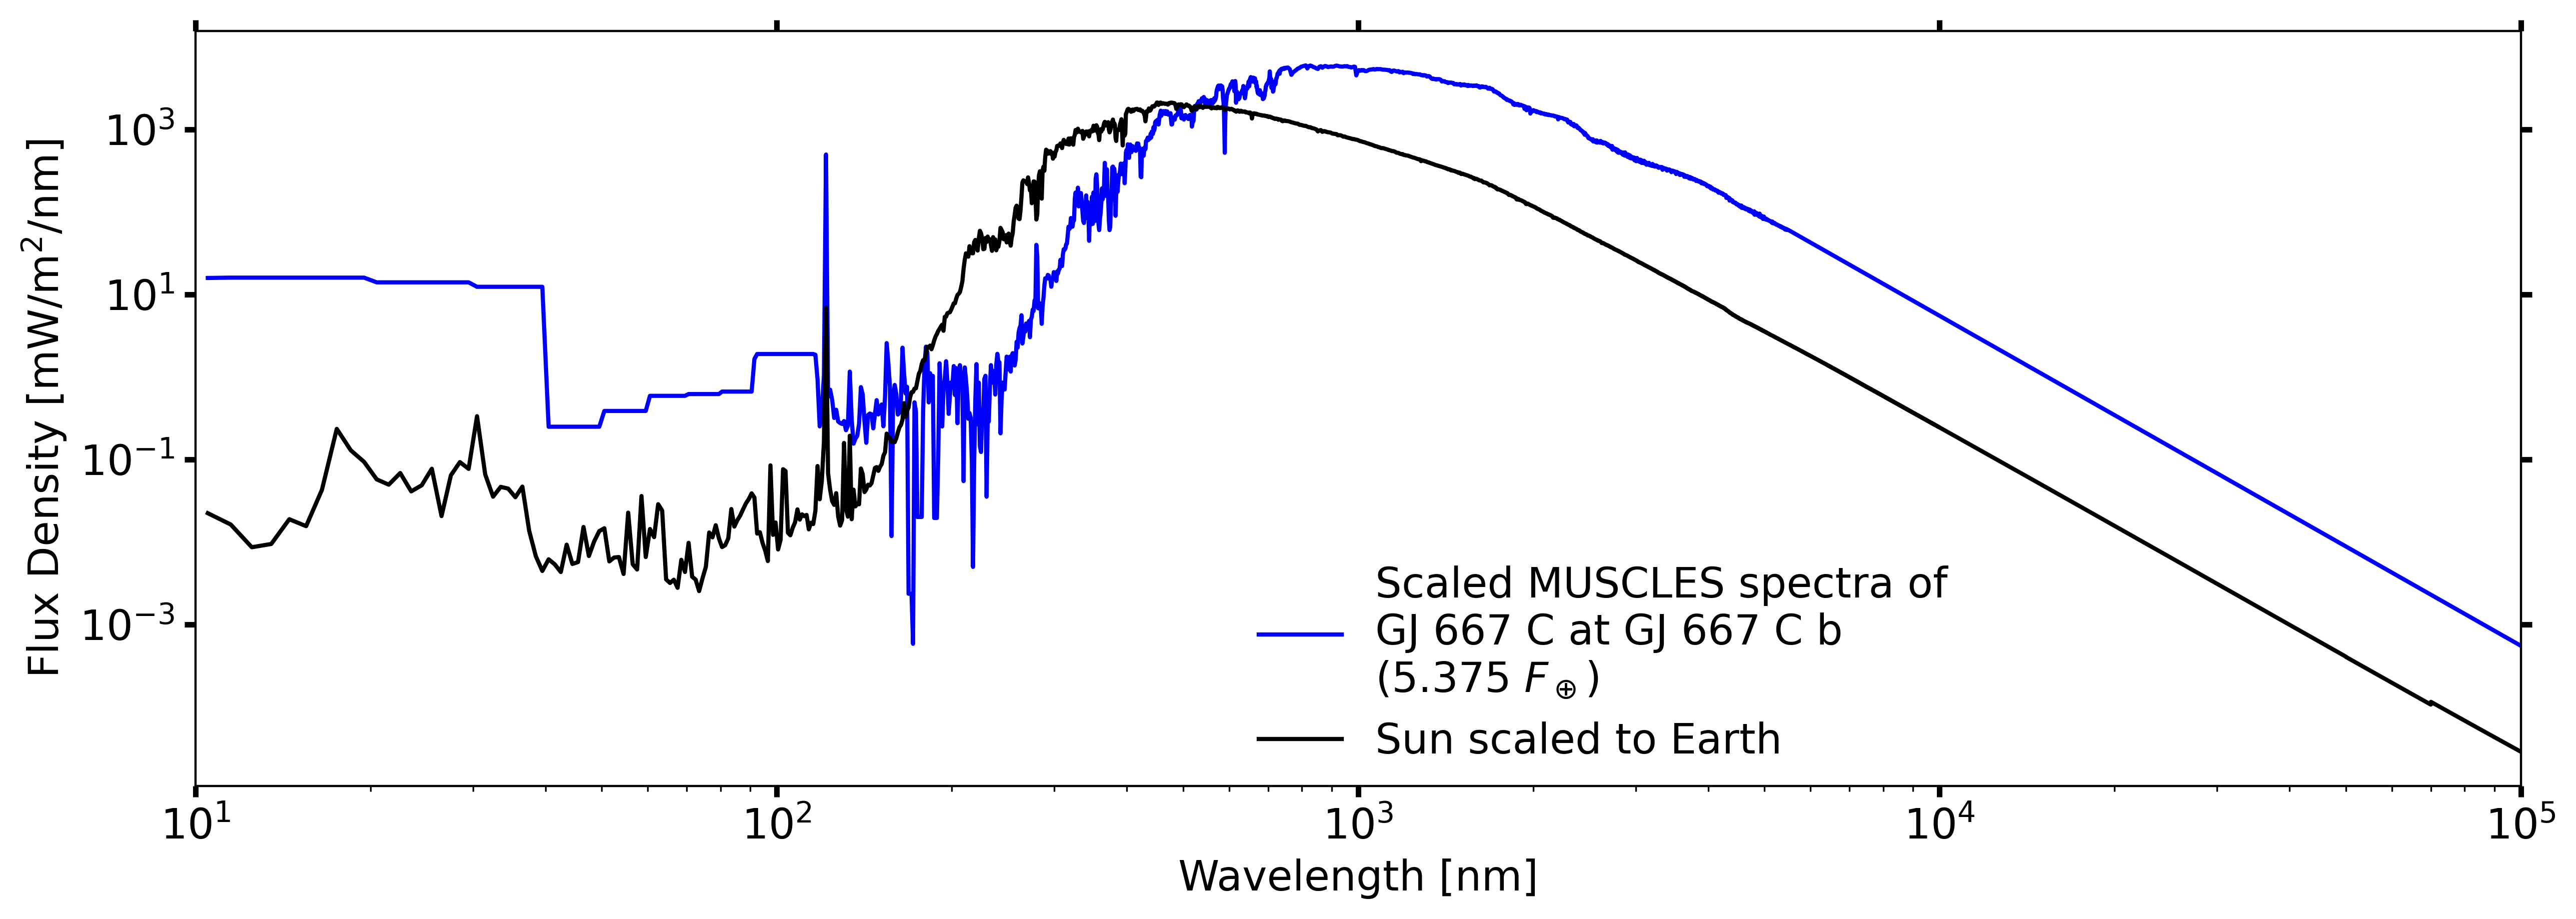
Open-source Python code in Jupyter Notebook on GitHub
I have developed two Jupyter Notebooks which are both ongoing projects.
One is the Stellar Wind and Irradiance Module (SWIM). This code takes a spectra from the Mega-MUSCLES survey and scales that spectra to a particular exoplanet around the star you have chosen. It also rebins the spectra based on your model of choice. It is easy to use and the user only needs to clone the GitHub repository. All options are given in drop down menus.
The other is a Jupyter Notebook that uses drop down menus to select different types of climate plots from 3D climate data. The user can then plot different variables such as surface sea ice fraction, the atmospheric temperature, and the atmospheric ozone mixing ratio.
Astrophysicist
This section will be updated with posts about ongoing work, talks, code updates, and results, as well as moments from my life! Please get in touch at gjc53@cam.ac.uk if you have any questions about my work.